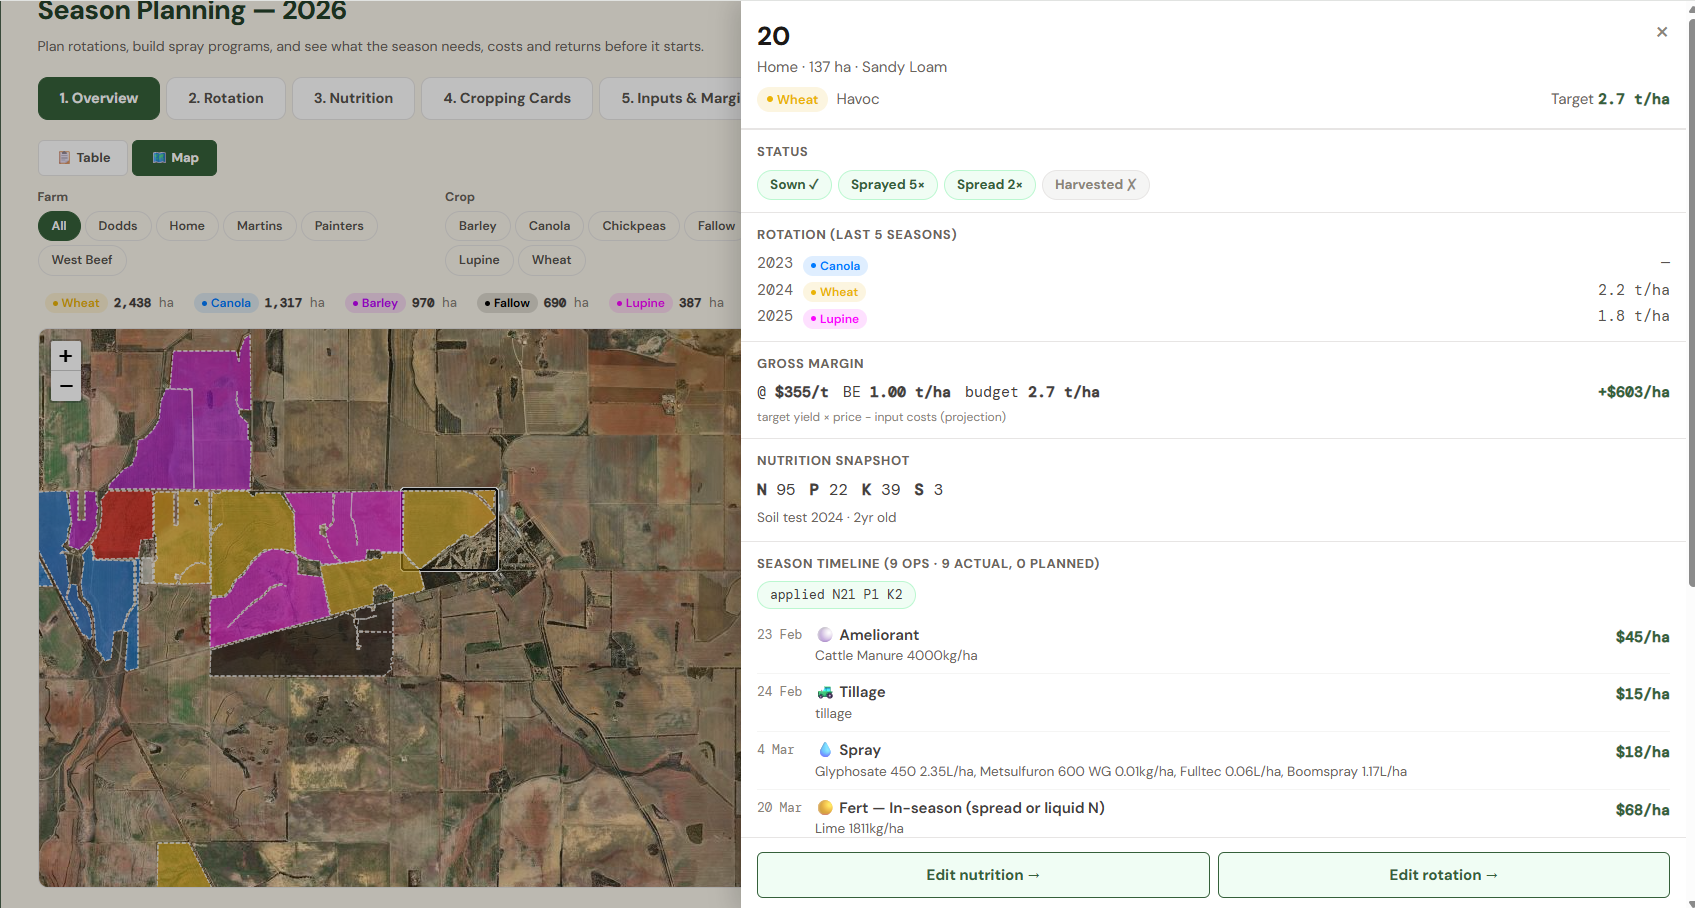
Tap a paddock. See the whole season.
Status, rotation, gross margin at today’s price, the nutrition snapshot and every pass so far, beside the map. Edit the plan or the program from there. This is the screen the rest of PaddIQ exists to fill.
PaddIQ turns every pass on every paddock into a record with its cost locked in. Plans, fert programs, stock, prescriptions and the season’s margin all read from those same records, so nothing is typed twice and nothing disagrees. One farm, one set of numbers, every device.

Records are the heart of PaddIQ, and there are two ways they get there. Pick either, or both.
Build the season in Planning: cropping cards for each crop, the fert program from the recommender, both approved by you. Every pass becomes a planned record on the paddock.
A PDF or spreadsheet field report from any machine brand reads in the same way.
Connect John Deere Operations Center™ once. Boundaries, every seeding, spray, spread and harvest, fuel and machine hours arrive as records on their own and are matched to the plan they came from. You review, you don’t retype.
Yield and as-applied maps land in the layer library, and prescriptions go back the other way.
More connectionsComing soon

Status, rotation, gross margin at today’s price, the nutrition snapshot and every pass so far, beside the map. Edit the plan or the program from there. This is the screen the rest of PaddIQ exists to fill.

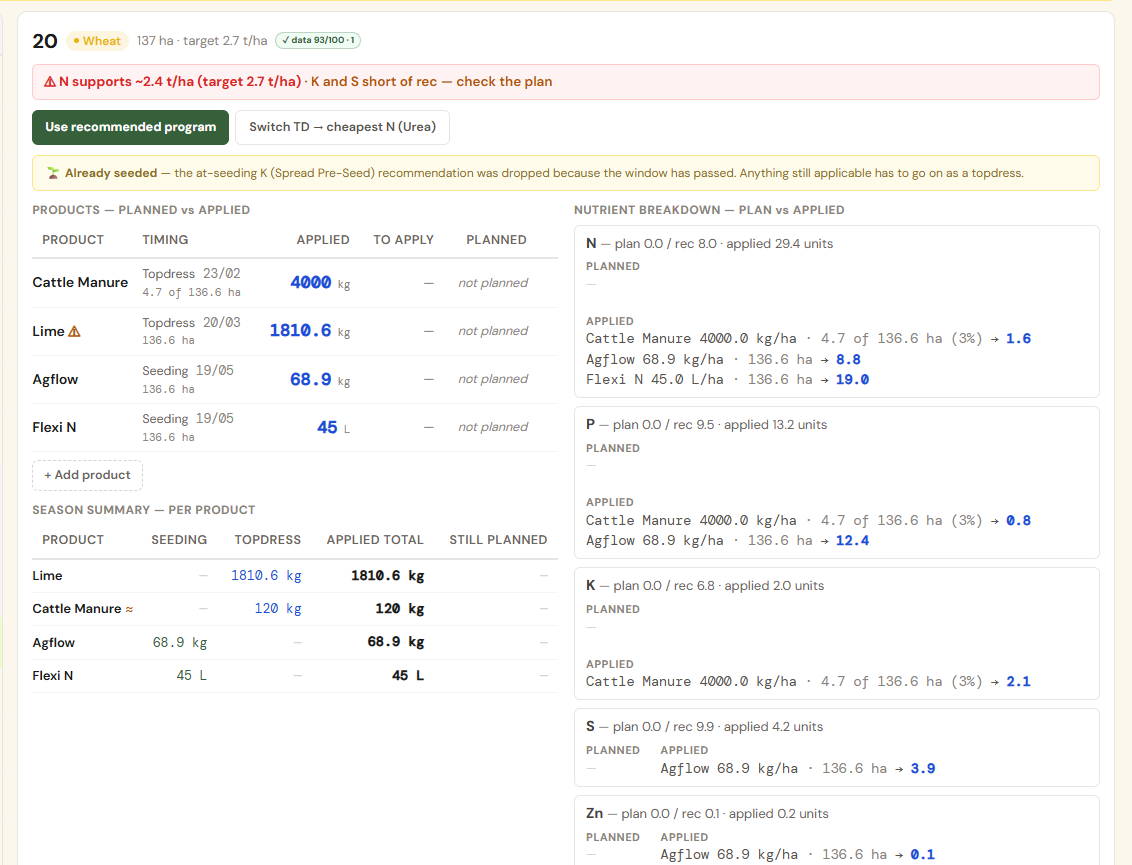
Every paddock carries its soil test, its target yield and what has already gone on. The recommender turns that plus today's grain and fertiliser prices into an economic-optimum program, then shows planned against applied, nutrient by nutrient, as the season unfolds.

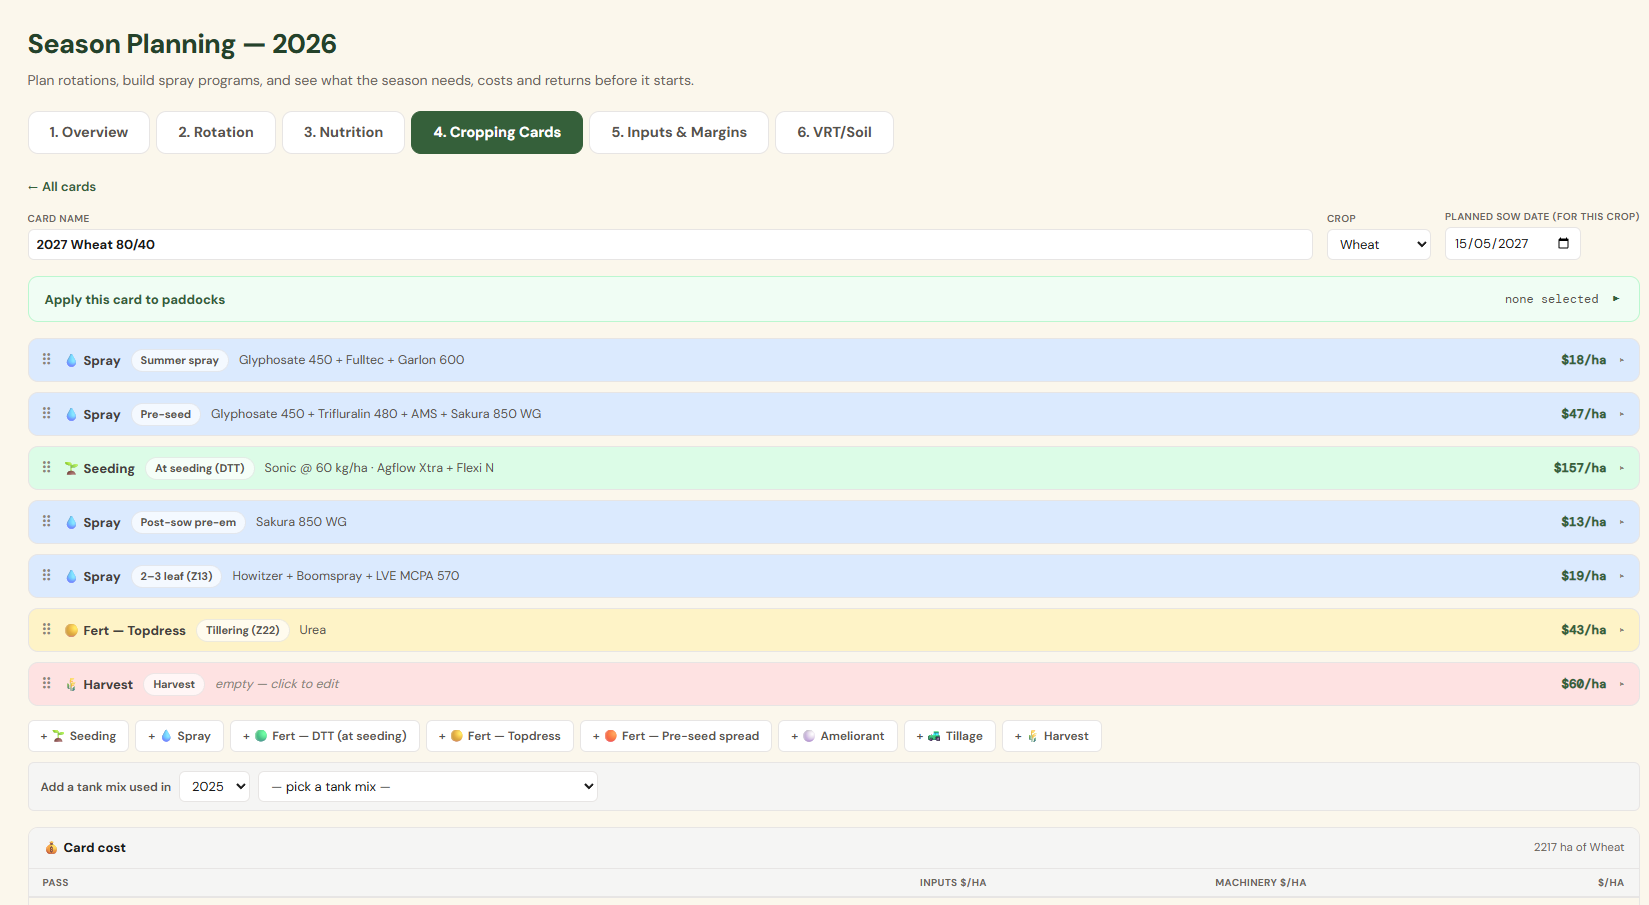
A cropping card is a whole season for one crop: summer spray, pre-seed, sowing with the fert down the tube, post-em, topdress, harvest. Cost per hectare on every pass. Apply it to the paddocks in that rotation and the season is planned and priced in minutes.

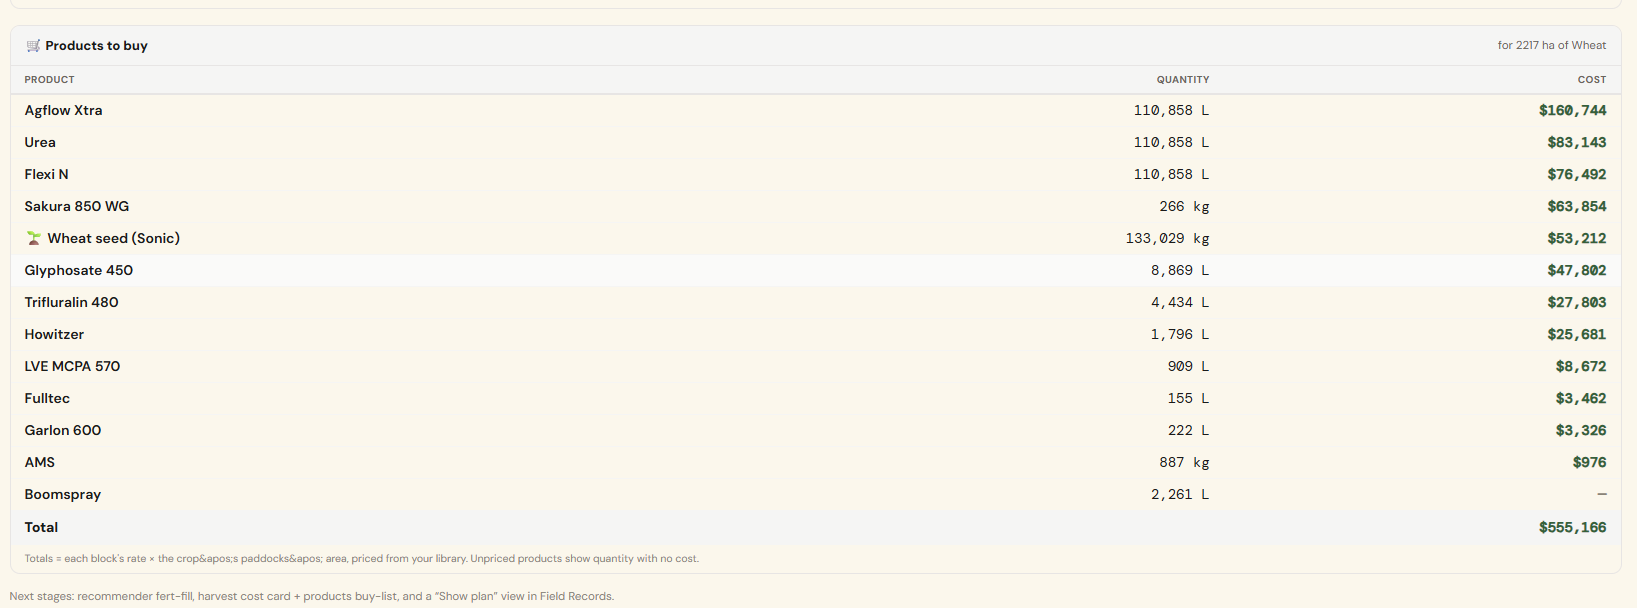
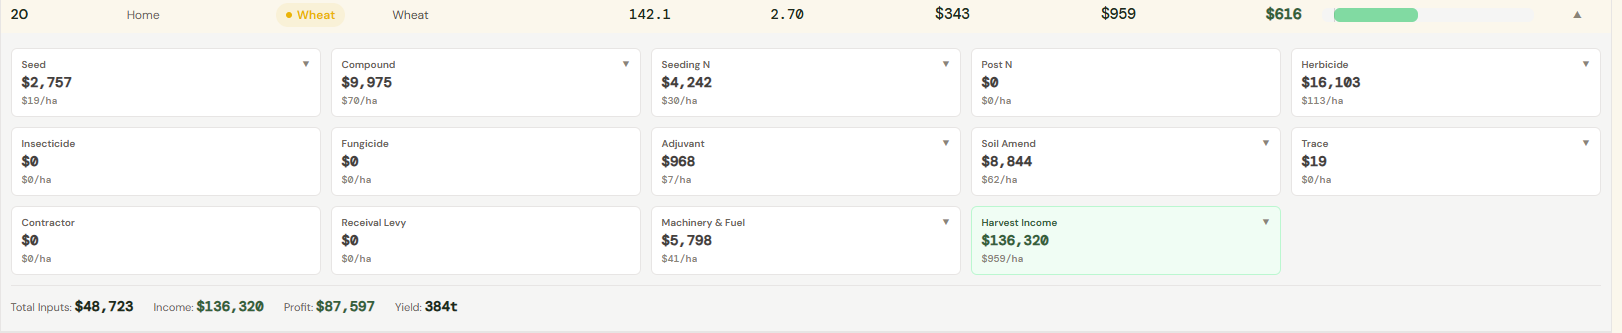
Every product the plan needs, in the quantity the paddocks need, priced from your own library. Products the recommender suggests that you have not accepted yet sit beside it, so the buy list is complete before the rep rings. Then the margin per crop, and each paddock’s plan against its own history of that crop.

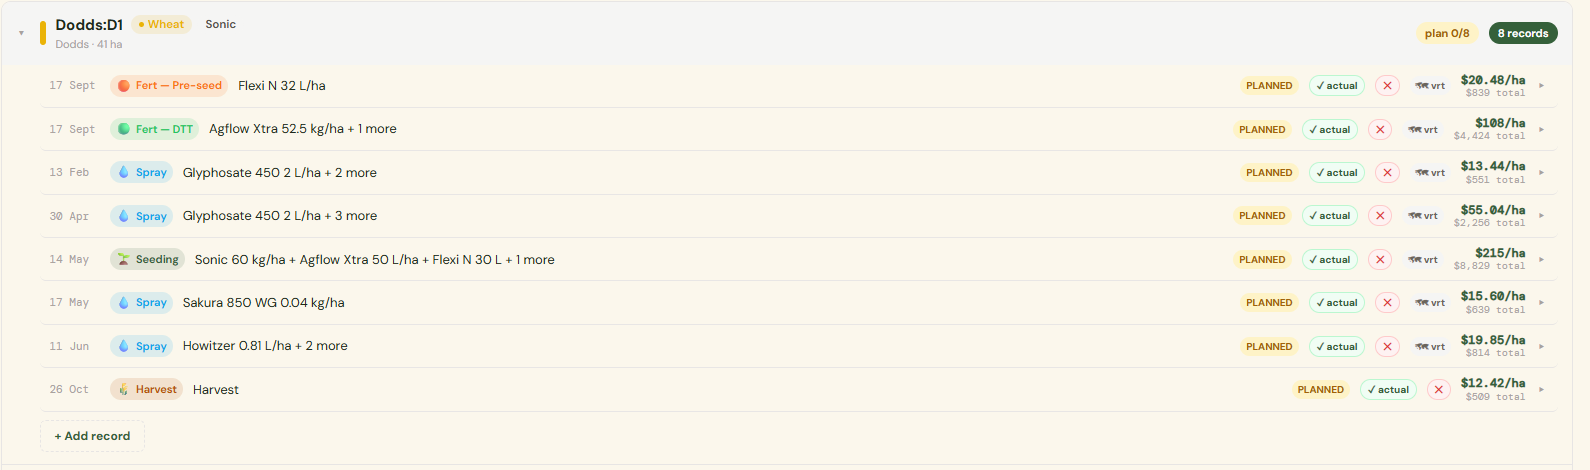
Whether it was ticked off by hand, read from a field report, or synced from Operations Center, every pass ends up as the same record: product, rate, rig, fuel, cost per hectare, frozen on the day. Every import is shown for checking before it lands.

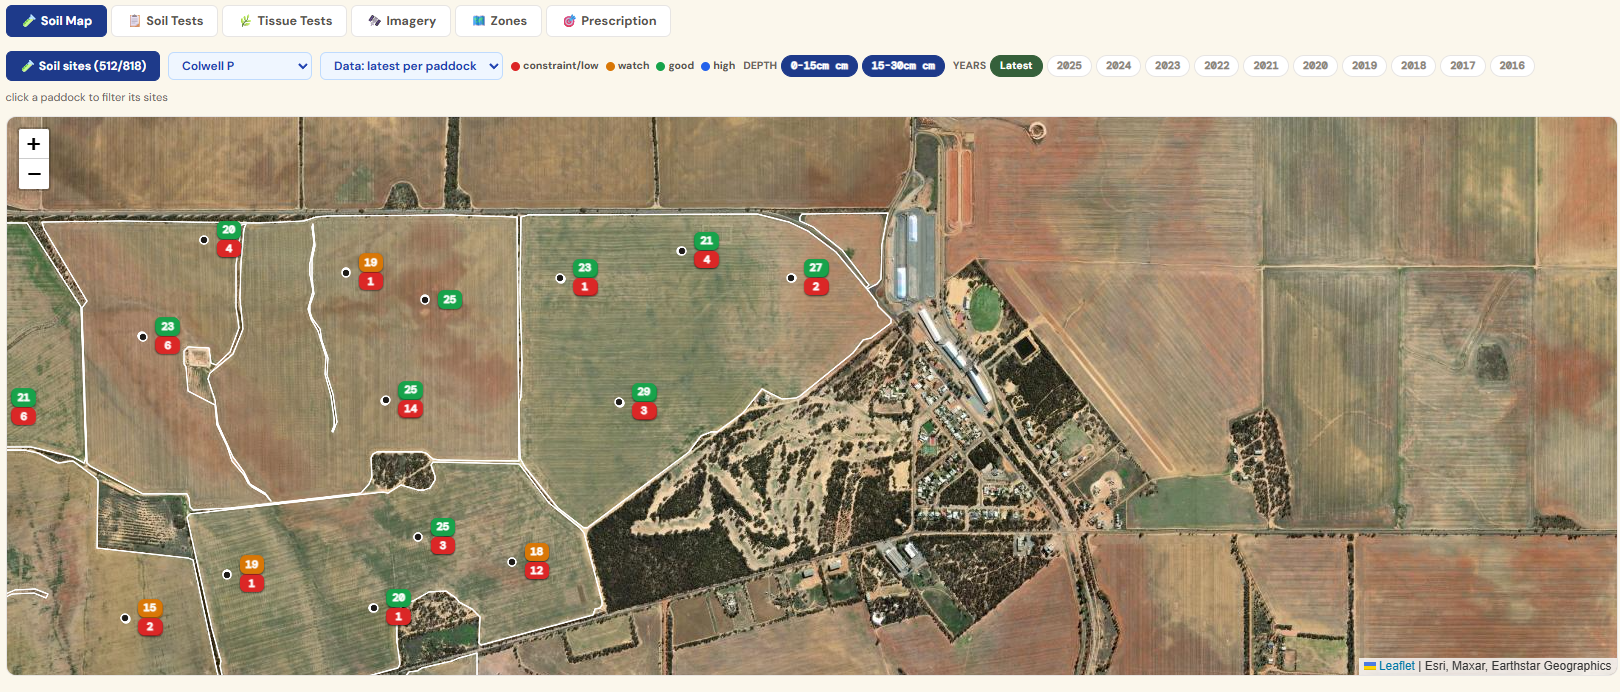
Every sample site at its GPS point, coloured against the critical value for that analyte, depth by depth, year by year. Drop in the lab's file, a PDF, or a photo of the report, from any lab. Units are converted for you and every column is checked with you before it saves.

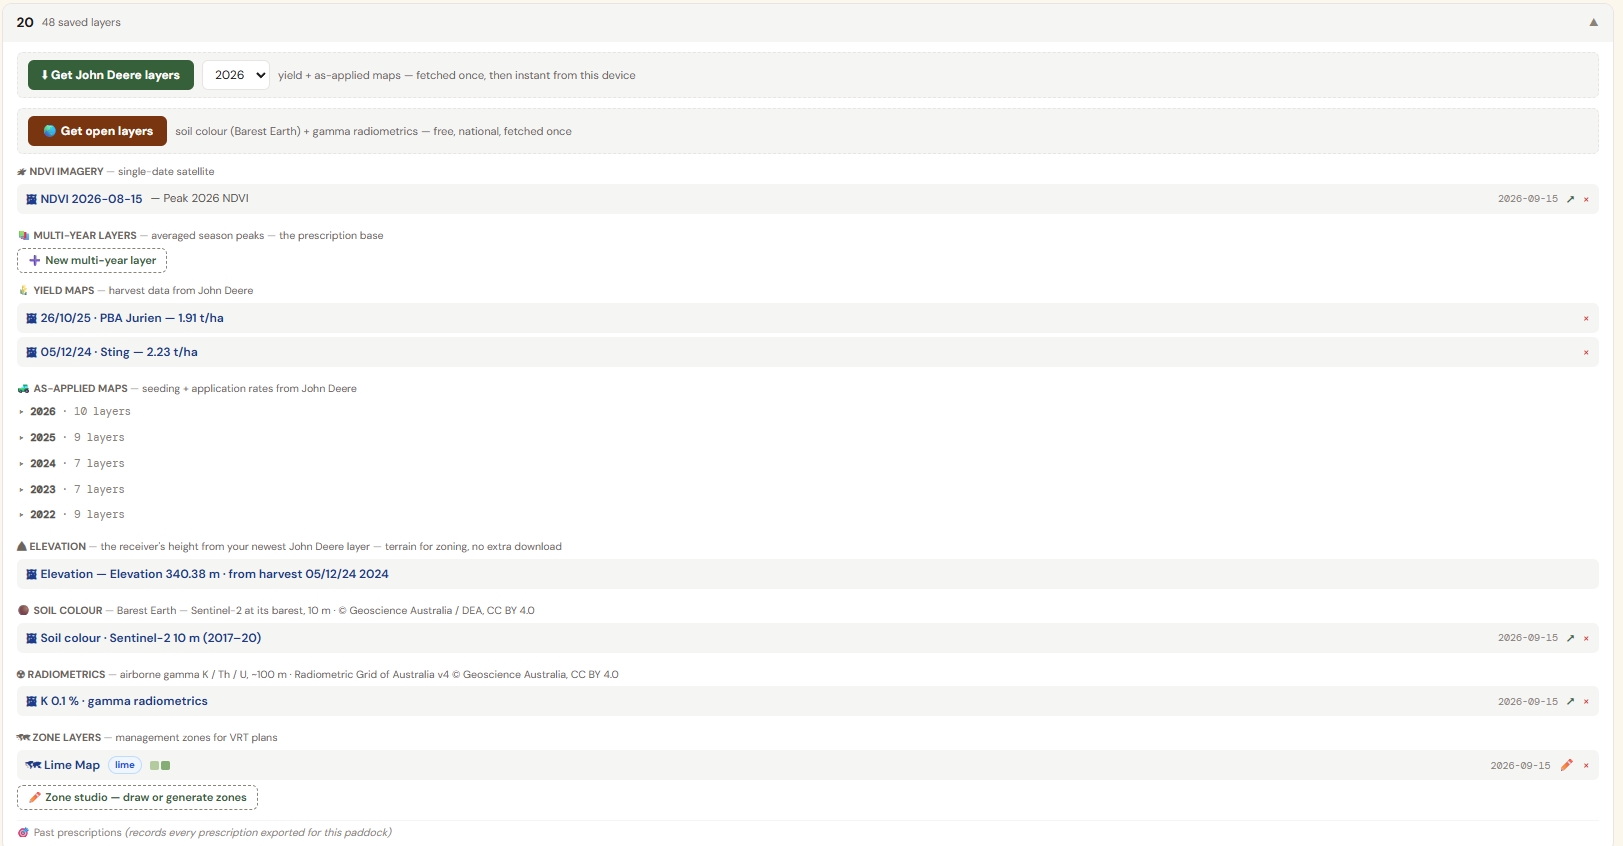
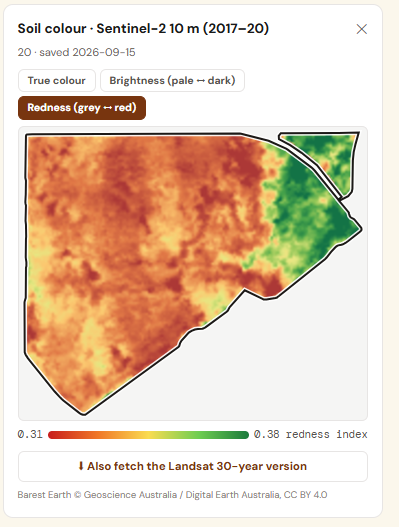
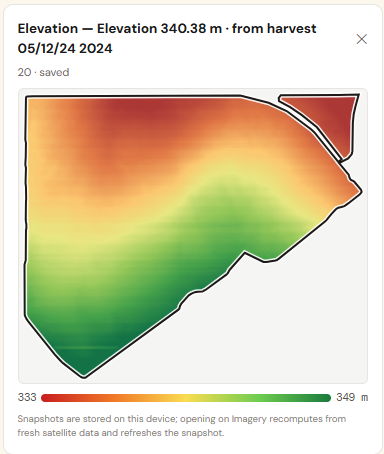
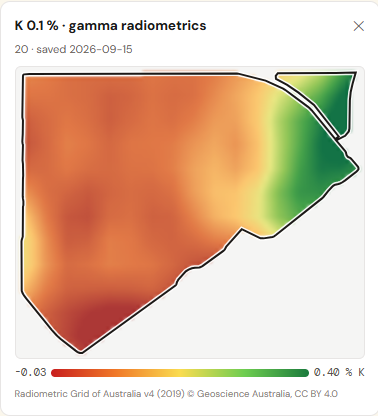
Yield and as-applied maps from Operations Center, satellite biomass back to 2017, elevation from your own header, soil colour and gamma radiometrics from national datasets. All free, all saved on your device, all ready to blend into zones.


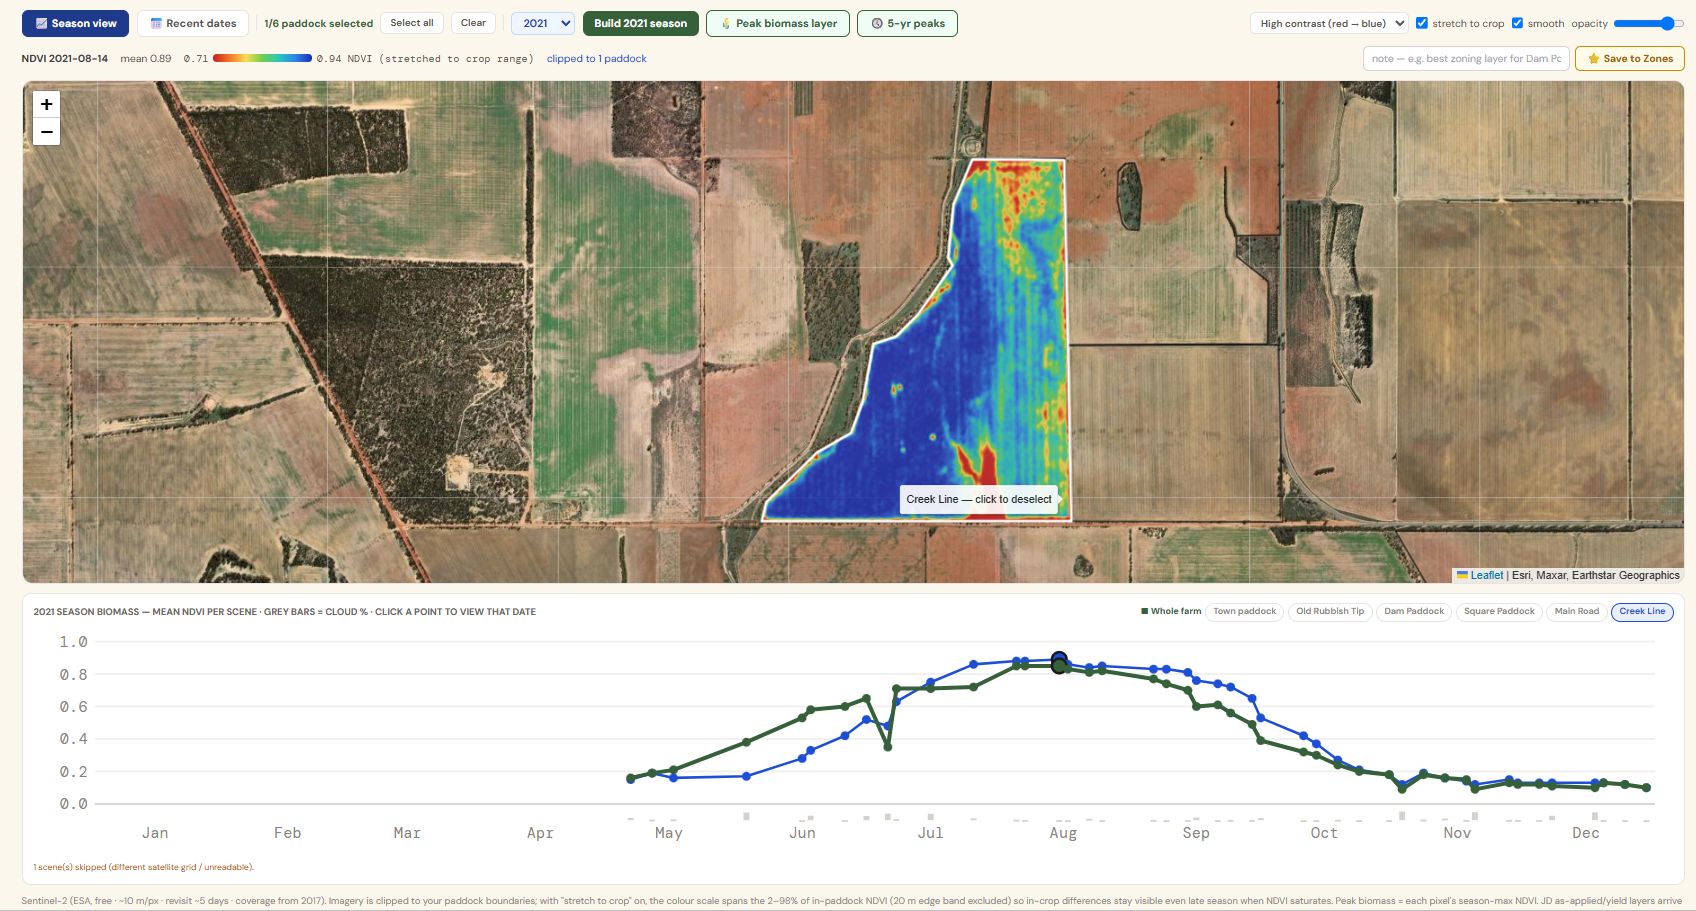
Every Sentinel-2 pass over the farm, filtered for cloud, as biomass, red-edge and moisture indices. Flick through a season, compare years, or build the multi-year peak that shows where a paddock always does well and where it never does. No subscription, nothing to install.

Add a gauge per location, drop its pin, tick the farms it serves, and log a reading from the phone in ten seconds. Months you miss fill from the SILO grid at the pin. Each farm's paddocks then run on their own rain for the water-limited yield ceiling and N mineralisation.
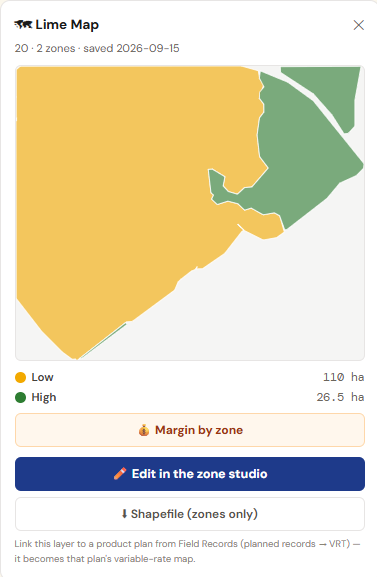
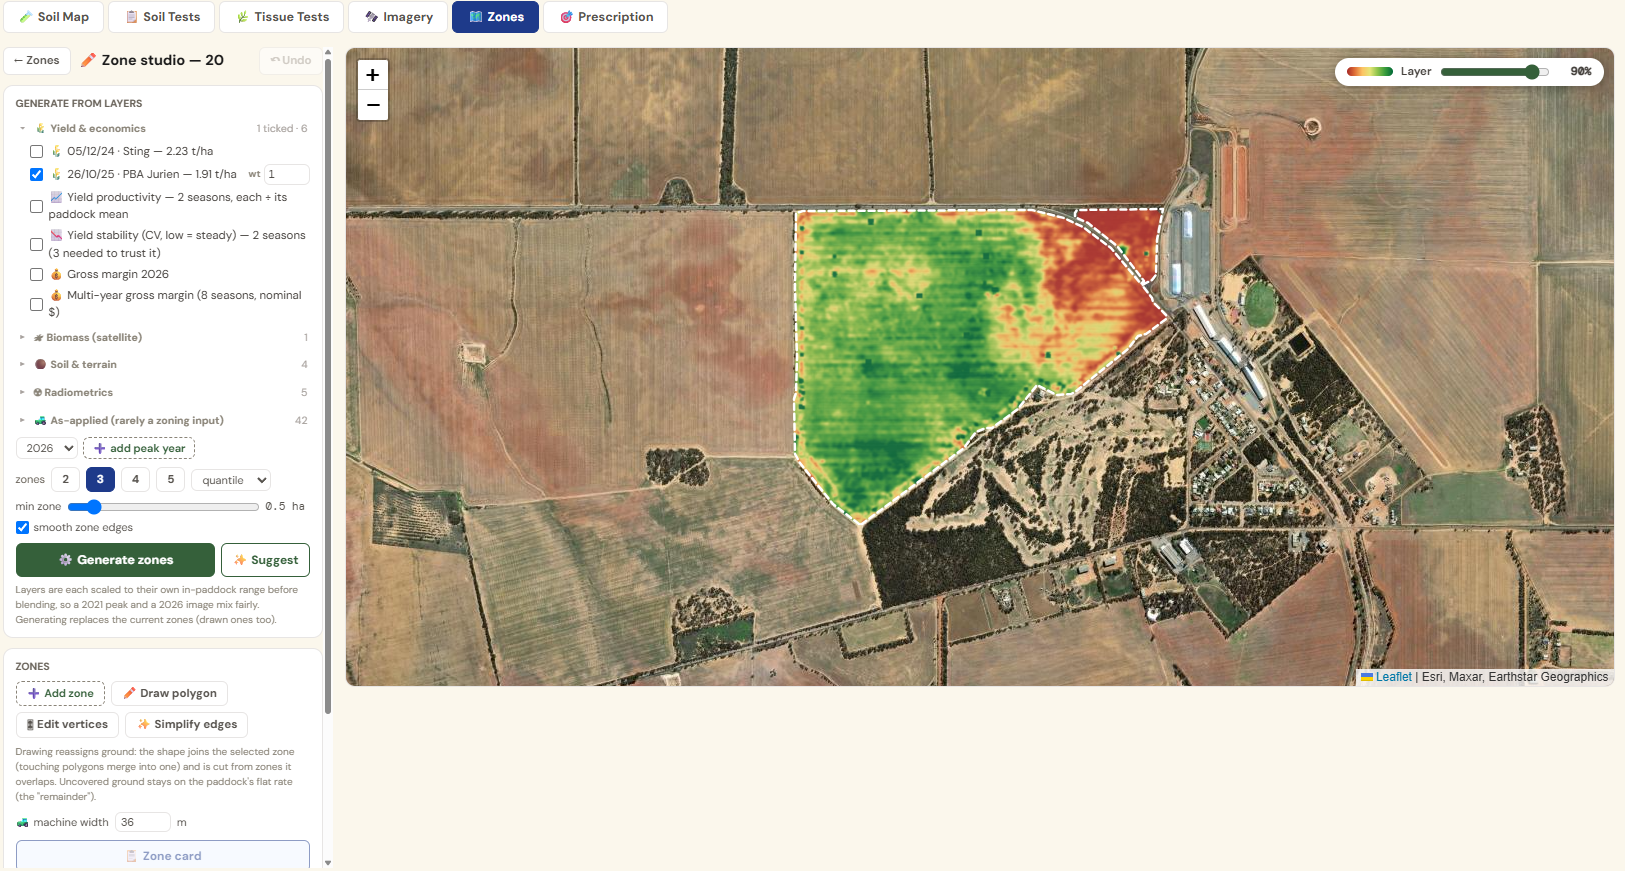
Tick the layers, weight them, pick two to five zones and let the studio draw them, or draw and edit them by hand to the machine's width. Set a rate per zone against the planned record it belongs to, then export the shapefile or send the prescription to Operations Center.

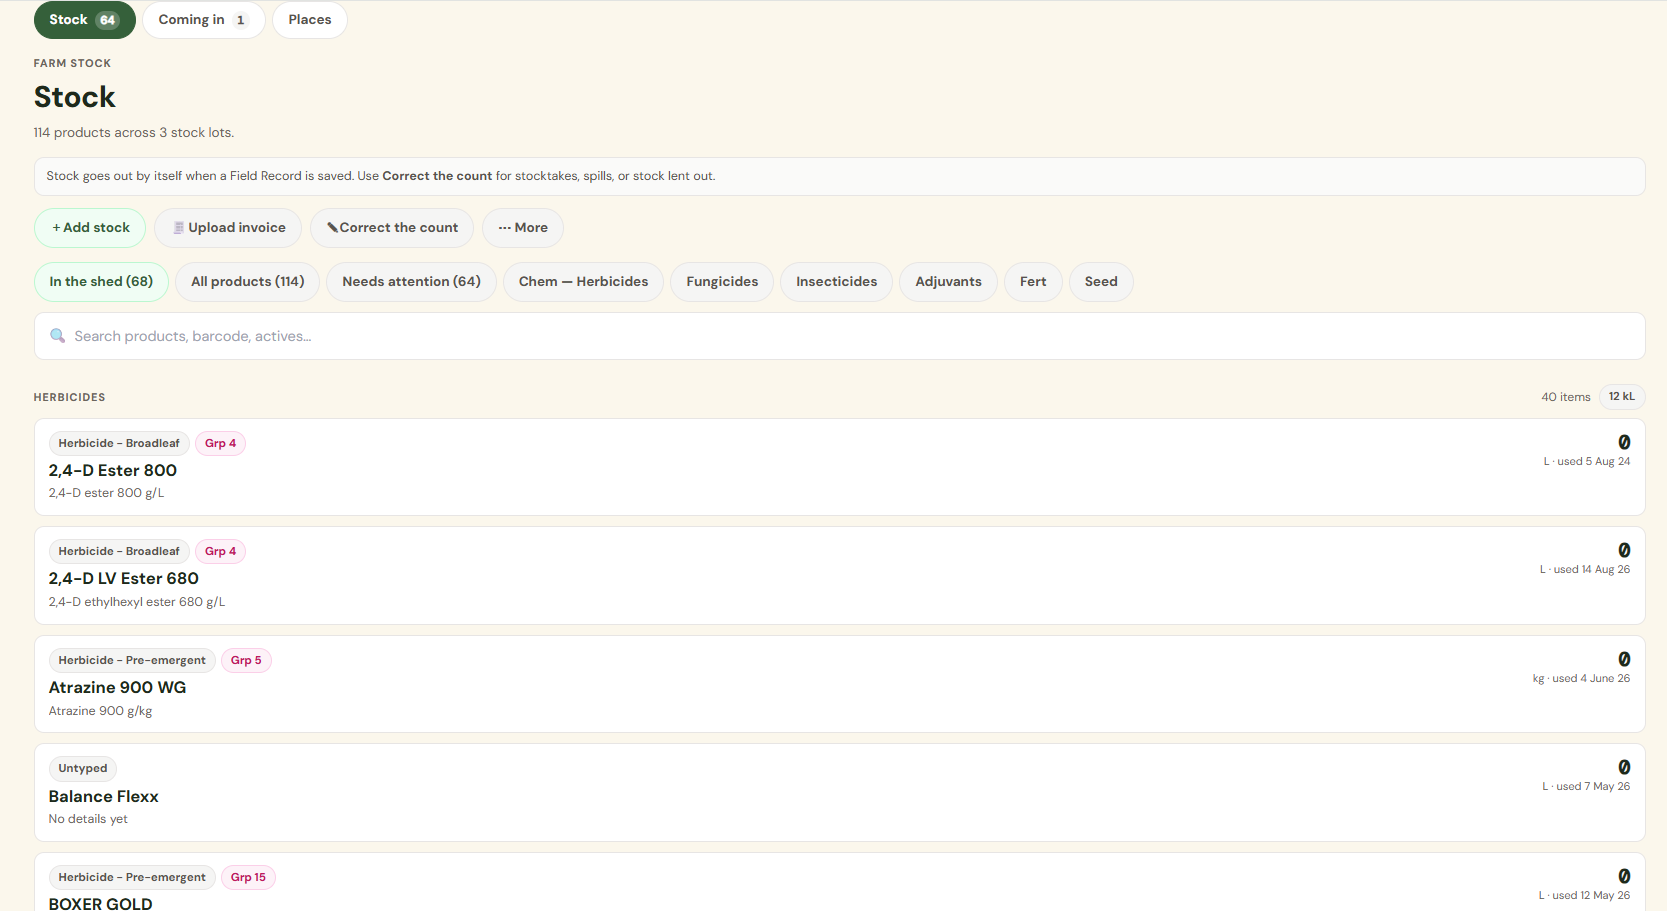
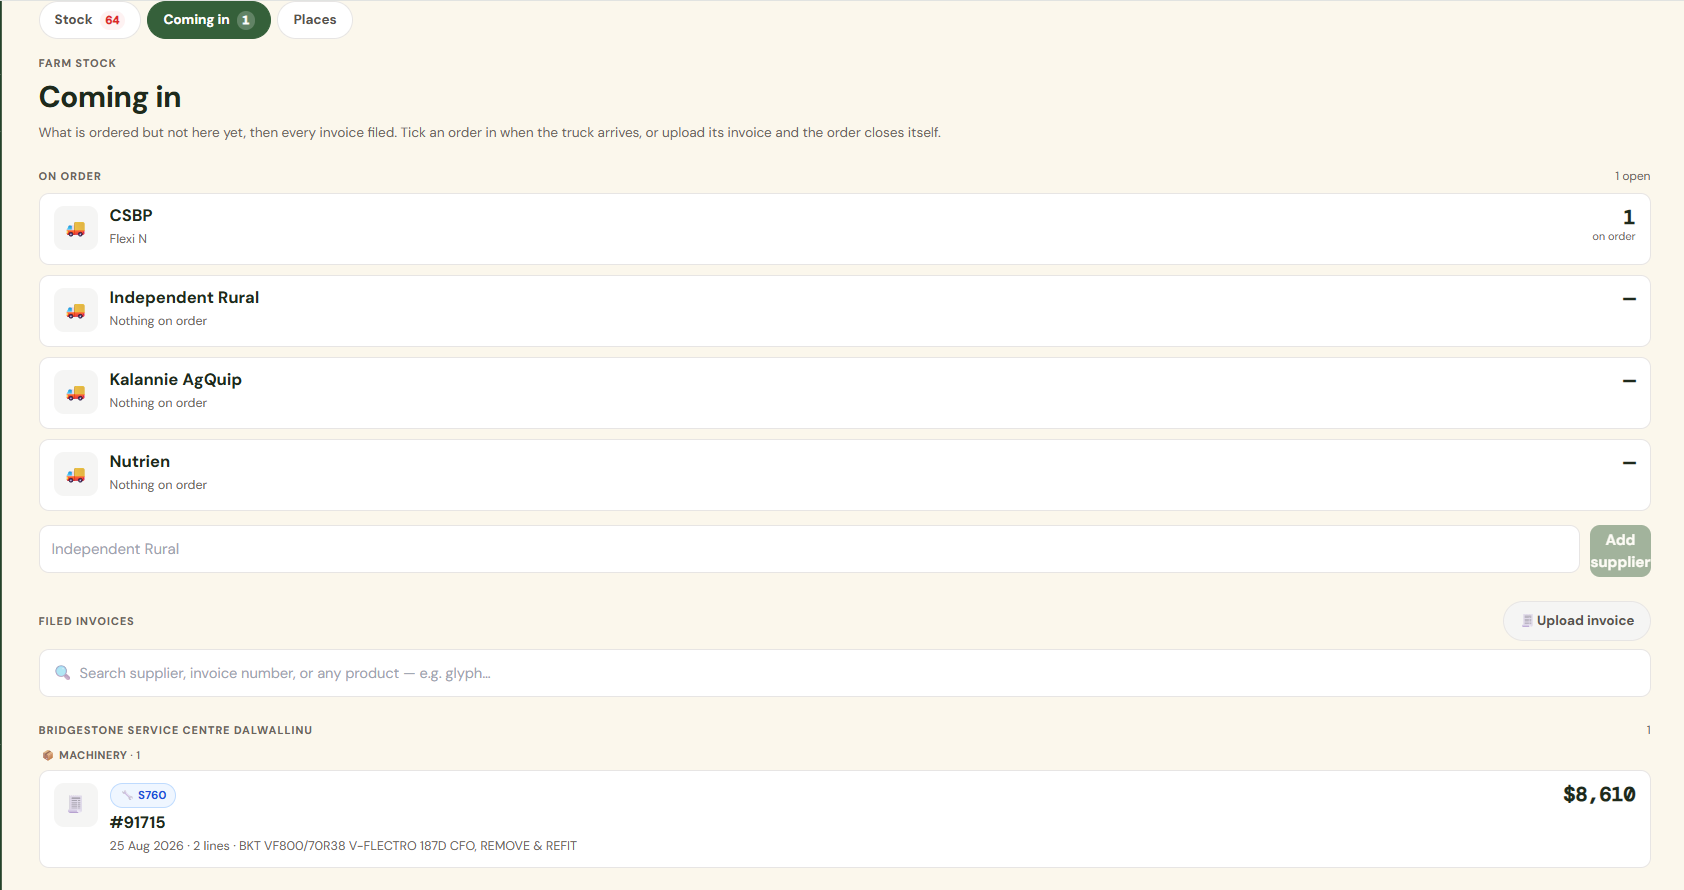
Stock goes out by itself when a record is saved. Invoices, delivery dockets and orders come in through one door, read by photo. Silos, tanks and sheds each show what they hold and how full they are, and a member can count one from the phone standing in front of it.


Invite anyone by email. Pick which tabs they see and whether they can edit. Their saves land on your farm and changes to access reach them within a minute. Remove them and they are out.

PaddIQ is in early access with growers now. Pricing opens when the Operations Center connection moves to production.
No. The Connected plan makes it automatic, but boundaries can be drawn or imported from a shapefile, and passes come in from PDF or spreadsheet field reports, or are typed in. Everything else is the same.
You do. Everything you enter stays in your account, syncs across your devices, and exports in full as a backup whenever you like. Delete the account and it is gone.
Yes. The app keeps the farm on the device and syncs when it is back in range, so a record logged in the cab lands when you reach the shed.
PCT, CSBP, Nutrient Advantage and any spreadsheet with a paddock column, plus a photo or PDF of a report. Every column is shown for checking before anything is saved, and units are converted for you.
Satellite biomass from Sentinel-2, soil colour from Geoscience Australia’s Barest Earth, gamma radiometrics from the national grid, elevation from your own header’s receiver, and yield and as-applied maps from Operations Center. All are free to you.
Invite them by email. You choose which tabs each person sees and whether they can edit, and changes apply within a minute.
Start with a map and one season of records. Everything else follows.
Get started